Lessons from MHA's National Screening and Prevention Program
Trends from our 2024 mental health data
Trends from our 2024 mental health data
“I want answers so that I can learn to control it.”
– Anonymous ADHD screener
In 2014, Mental Health America (MHA) created the Online Screening Program (www.mhascreening.org), a collection of 11 free, anonymous, confidential, and clinically validated screens that are among the most commonly used mental health screening tools in clinical settings. Since its launch, over 31 million people have taken a screen to check their mental health concerns online, making this program the nation’s largest ongoing, real-time mental health early identification program. The program has grown exponentially over the decade, expanding from an average of 1 million screens per year to a staggering 6 million a year since 2021. With this uptick in screens, more people are experiencing depression, suicidal ideation, addiction issues and other mental health concerns.
MHA’s online screening reach has also transformed dramatically. In 2024, supported over 5.9 million individuals (n=5,930,486) seeking mental health screening across the globe. Historically, 90% of screeners were from the U.S., but over the past three years, our reach has expanded quickly among international screeners. Among English-language screeners, 1,728,957 (44%) of 2024 screens were domestic, 2,204,291 (55%) were international, and the remainder–about 1,405,709 screens– did not answer the “Do you live in the U.S.?” question.
This report is an analysis of responses from the 1,728,957 screens taken by those who self-reported living in the U.S. In 2024, 98% of domestic users answered at least one demographic question.

The average MHA screener is a young female student who has never received treatment for a mental health condition.
In total, 1,728,957 people living in the United States took a screen through the MHA online National Screening and Prevention Program in 2024. As the top search result for “mental health test” on search engines such as Google and Bing, MHA’s screening program has helped address unmet needs and bridge gaps in communities that are most vulnerable to mental health conditions. MHA screening data continues to provide insightful real-time information from screeners who have yet to or cannot access traditional health care systems. Unlike other data sets, the MHA screening population is help-seeking, meaning it is largely representative of populations that are most likely to seek help for mental health conditions (young, female, high-risk groups, for example). Otherwise, MHA screening demographics align with U.S. Census data for race, income, and geographical representation.
Forty-two percent of screeners in 2024 were under 18, a 1% increase from 2023 (41%). Users under 25 made up over two-thirds of all screens for 2023 (65%) and 2024 (64%).
Age range
8-10: 1.19%, N=19,585
11-13: 15.12%, N=247,771
14-15: 14.54%, N=238,389
16-17: 10.84%, N=177,607
18-24: 22.15%, N=363,125
25-34: 16.96%, N=277,952
35-44: 9.88%, N=161,944
45-54: 5.22%, N=85,617
55-64: 2.73%, N=44,671
65+: 1.36%, N=22,730
The race/ethnicity demographics of U.S. screeners in 2024 were mostly on par with demographics from 2023.
American Indian or Alaska Native: 2.20%, N=36,201
Asian: 7.97%, N=131,203
Black or African American (non-Hispanic): 8.92%, N=146,733
Hispanic or Latino: 14.48%, N=238,328
Middle Eastern or North African: 1.00%, N=16,478
Native Hawaiian or other Pacific Islander: 0.47%, N=7,807
White (non-Hispanic): 55.76%, N=917,470
More than one of the above: 6.11%, N=100,485
Other: 3.08%, N=50,687
Screeners in 2024 reported higher household incomes than those in 2023. While the percentage of those with an income of less than $40,000 didn’t change, 28% of screeners in the U.S. reported a household income of $100,000 or greater in 2024, compared to 25% of screeners in 2023.
Less than $20,000: 19.44%, N=244,094
$20,000-$39,999: 15.80%, N=198,340
$40,000-$59,999: 14.82%, N=186,056
$60,000-$79,999: 12.46%, N=156,472
$80,000-$99,999: 9.98%, N=125,326
$100,000-$149,999: 13.87%, N=174,112
$150,000+: 13.64%, N=171,203

Roughly 64% of screeners identified as female, 32% identified as male, and 5% identified as non-binary. Nearly 6% of screeners from the U.S. (N=92,443) identified as transgender in 2024.

We also ask screeners: “Which of the following populations describes you? Check all that apply.” Overwhelmingly, 69% of responses (N=820,947) included students, followed by LGBTQ+ (28%, N=336,229), and trauma survivors (26%, N=315,865).
We also invited trauma survivors to elaborate more on their experiences with trauma. Nearly 60% of responses included family conflict as a source of trauma. This was followed closely by child abuse/violence and sexual assault/violence.
Across all screening tests, 78% (N=1,353,593) of users in the U.S. scored at risk for a mental health condition in 2024. This was fewer people compared to 2023 (N=1,667,892). Among positive screens, 57% of individuals indicated they had never received treatment for a mental health condition before.
Screening results
Depression screen – 435,849 at risk
Depression at risk
ADHD screen – 401,543 at risk
ADHD at risk
Anxiety screen – 168,881 at risk
Anxiety at risk
Bipolar screen – 90,281 at risk
Bipolar at risk
Psychosis screen – 73,579 at risk
Psychosis at risk
Eating disorder screen – 56,649 at risk
At risk for Eating disorder
At risk for Avoidant Restrictive Food Intake Disorder (ARFID)
PTSD screen – 55,472 at risk
PTSD at risk
Youth screen – 39,186 at risk
Youth at risk
Addiction screen – 14,459 at risk
Addiction at risk
Parent screen – 9,913 at risk
Parent screen at risk
Postpartum depression screen – 7,781 at risk
Postpartum depression at risk
“The constant woes of life far outweigh the joys”
– Anonymous depression screener
MHA uses the Patient Health Questionnaire 9-item (PHQ-9) tool to screen for depression. In 2024, 526,461 people in the U.S. took a depression screen. Suicidal/self-harm thinking, especially among young people, remains an epidemic.. Since June 2020, MHA has seen a steady increase in the rate of frequent suicidal ideation, defined as thoughts of suicide more than half the week or nearly every day. Overall, 37% (N=196,364) of individuals in the U.S. who took the PHQ-9 screen for depression reported frequent suicidal ideation in 2024. This was a slightly higher rate than 2023 (36%; N=201,497).
On average, 87% (N=218,010) of people under 18 in the U.S. who took a depression screen scored positive for symptoms of moderate to severe depression in 2024. Trends indicate that rates of screening severity decrease as age increases.
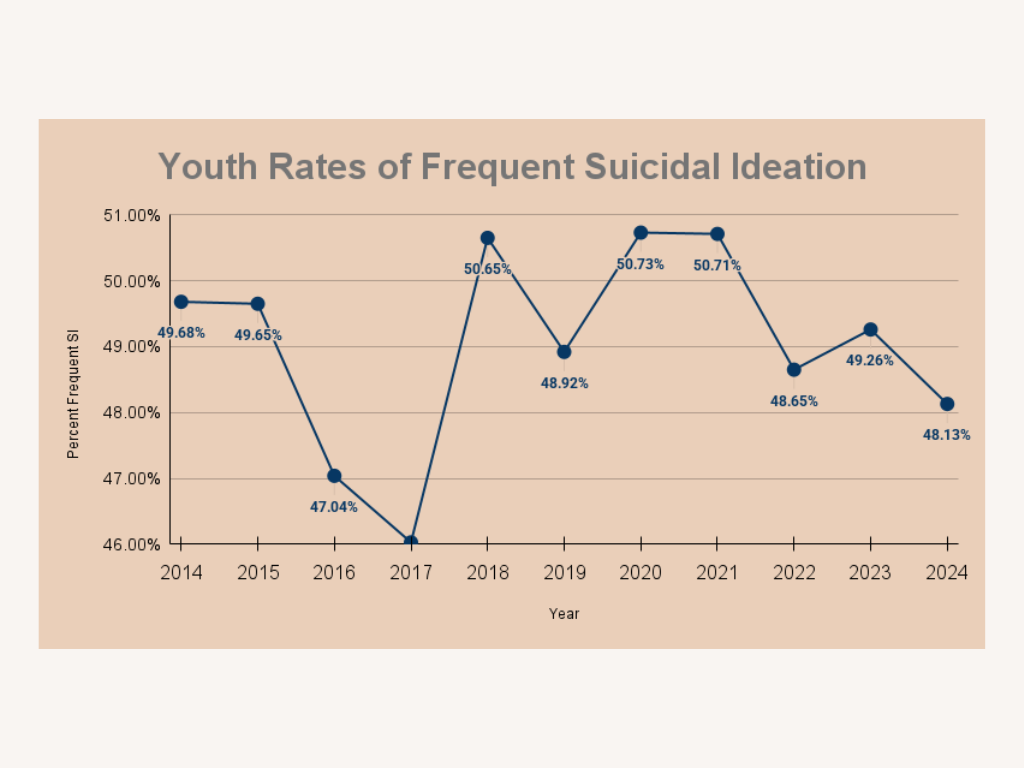
According to Pew Research, youth suicide risk has trended upwards between 2011 and 2021, with 22% of high school students reporting that they had considered suicide in 2021, up from 16% in 2011. MHA has also seen concerning trends in youth suicidal ideation frequency, more than double the rate reported by Pew. Though rates of ideation have remained mostly stagnant, MHA saw peaks of more than half of youth under 18 reporting frequent suicidal ideation in 2018, 2020 and 2021.
In 2024, 48% of all youth depression screeners under 18 reported frequent suicidal ideation, compared to 49% (N=111,077) of youth in 2023.
In 2024, 82.79% of all screeners who took a depression screen scored at risk (with moderate to severe symptoms on the PHQ-9). Similar to 2023, the percentage of people scoring with moderate to severe symptoms of depression was highest among screeners who identified as more than one race (87%) and the lowest among those who identified as Asian (80%).
American Indian or Alaska Native: 86.02%
Asian: 79.79%
Black Or African American (non-Hispanic): 80.58%
Hispanic or Latino: 84.16%
Middle Eastern or North African: 82.97%
Native Hawaiian or other Pacific Islander: 83.02%
White (non-Hispanic): 82.60%
More than one of the above: 87.16%
Other: 85.15%
Youth of color took the depression test more often than youth screeners who are white, but rates of moderate to severe depression were equal among both groups. In 2024, 87% (N=113,226) of youth of color under 18 who took a depression screen scored with moderate to severe depression, compared to 87% (N=95,305) of white youth. When results are broken down by race/ethnicity, there are more notable differences. Rates of moderate to severe depression were highest among youth who identified as more than one race (89%) and lowest among screeners identifying as Asian (84%).
American Indian or Alaska Native: 87.88%
Asian: 83.66%
Black or African American (non-Hispanic): 86.18%
Hispanic or Latino: 87.43%
Middle Eastern or North African: 86.53%
Native Hawaiian or other Pacific Islander: 88.84%
White (non-Hispanic): 86.94%
More than one of the above: 89.41%
Other: 88.47%
Rates of suicidal ideation (reporting thoughts of suicide more than half the week or nearly every day on PHQ-9 item #9) continue to be much higher than the pre-pandemic average for screeners of every race/ethnicity. In 2024, the percentage of people reporting frequent thoughts of suicide or self-harm was highest among American Indian or Alaska Native screeners (48%). Interestingly, rates of suicidal ideation for BIPOC screeners were higher than rates for white users. Additionally, rates of frequent suicidal ideation increased 4%for Middle Eastern or North African screeners and 1%for Asian, Black, Hispanic or Latino, and white screeners when compared to 2023.
American Indian or Alaska Native: 47.76%
Asian: 37.76%
Black or African American (non-Hispanic): 39.28%
Hispanic or Latino: 39.93%
Middle Eastern or North African: 40.37%
Native Hawaiian or other Pacific Islander: 41.99%
White (non-Hispanic): 34.16%
More than one of the above: 44.23%
Other: 46.60%
Rates of suicidal ideation were also higher among Black, Indigenous, and youth of color than among white youth. Among youth of color, 51% (N=65,717) reported thoughts of suicide or self-harm more than half the week or nearly every day, compared to 45% (N=49,436) of white youth. The percentage of youth under 18 reporting frequent thoughts of suicide or self-harm was also highest among those who identified their race as “other” (54%). Rates between 2023 and 2024 remained stagnant.
American Indian or Alaska Native: 51.90%
Asian: 48.00%
Black or African American (non-Hispanic): 51.98%
Hispanic or Latino: 49.80%
Middle Eastern or North African: 49.19%
Native Hawaiian or other Pacific Islander: 53.30%
White (non-Hispanic): 45.19%
More than one of the above: 51.04%
Other: 54.19%
“I see the world as if everything and everyone is against me”
– Anonymous LGBTQ+ screener
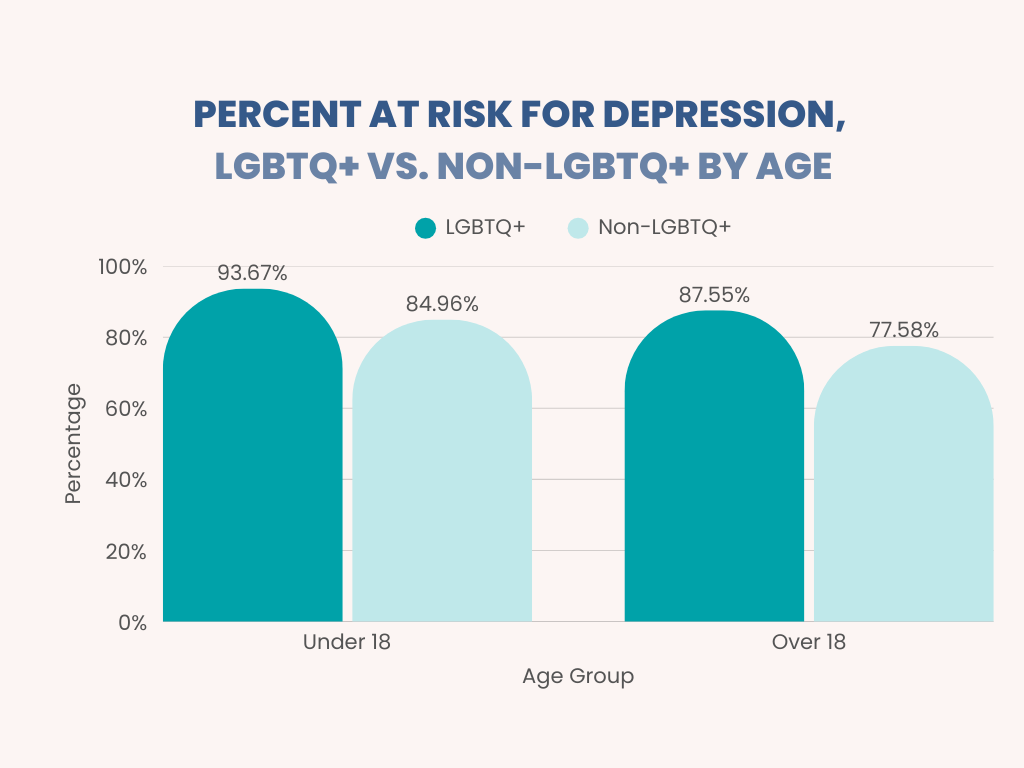
Both youth under 18 and adults who identify as LGBTQ+ and took a depression screen were nearly 10% more likely to screen with moderate to severe depression than non-LGBTQ+ youth and adults.
Rates of frequent suicidal ideation (reporting thoughts of suicide more than half the week or nearly every day on PHQ-9 item #9) among LGBTQ+ screeners dwarfs that of non-LGBTQ+ screeners. Additionally, transgender screeners report even more alarming rates of ideation.
General population – percentage of screeners reporting frequent SI
LGBTQ+: 52.58%
Transgender: 54.89%
Non-LGBTQ+: 34.03%
At risk for depression, percentage of screeners reporting frequent SI
LGBTQ+: 57.17%
Transgender: 61.12%
Non-LGBTQ+: 41.59%
Rates of suicidal ideation were particularly high among people of color who identified as LGBTQ+, greatly exceeding suicidal ideation rates for non-LGBTQ+ populations. LGBTQ+ individuals who identified their race as American Indian or Alaska Native had the highest reported rates of suicidal ideation (64%), followed by LGBTQ+ individuals identifying as other race (62%) and Native Hawaiian or other Pacific Islander (58%).
American Indian or Alaska Native
LGBTQ+: 63.71%
Non-LGBTQ+: 43.48%
Asian
LGBTQ+: 52.91%
Non-LGBTQ+: 35.48
Black or African American (Non-Hispanic)
LGBTQ+: 53.53%
Non-LGBTQ+: 36.29%
Hispanic or Latino
LGBTQ+: 54.18%
Non-LGBTQ+: 37.02%
Middle Eastern or North African
LGBTQ+: 55.48%
Non-LGBTQ+: 38.57%
Native Hawaiian or other Pacific Islander
LGBTQ+: 58.39%
Non-LGBTQ+: 38.91%
White (non-Hispanic)
LGBTQ+: 49.78%
Non-LGBTQ+: 30.78%
More than one of the above
LGBTQ+: 56.82%
Non-LGBTQ+: 39.80%
Other
LGBTQ+: 61.90%
Non-LGBTQ+: 42.92%
“I struggle without the stimulation”
– Anonymous BASC screener
Since 2014, MHA has used the CAGE-AID tool to screen for alcohol and/or substance use disorders (SUD). In August 2024, MHA expanded its addiction screening tools to include the Alcohol Symptom Checklist (ASC), Substance Use Symptom Checklist (SUSC), and an experimental Behavioral Addiction Symptom Checklist (BASC). With the implementation of the ASC, SUSC, and BASC, MHA has been able to gain further insights into the addictions and behaviors users struggle with. Interestingly, youth screeners have shown a fervent interest in screening for behavioral addiction concerns, accounting for nearly 70 percent of all BASC screens taken.
On the addiction screens, we ask the question: “Which of the following are you concerned about?” to gather insights on which substances and behaviors are contributing to users’ mental health concerns. Among top concerns for all ages were alcohol (43%) and cannabis/marijuana (40%). Furthermore, there is a clear generational divide between youth under 18 and transitional youth aged 18-24. Screeners under 18 are more likely to struggle with behavioral addiction concerns such as self-harm (45%), while screeners aged 18-24 are more likely to struggle with substances such as marijuana (54%).
MHA recognizes that there is a lot of fear and reluctance to seek help for alcohol and substance use. Analysis of users’ written responses to the question: “Think about your mental health test. What are the main things contributing to your mental health problems right now?” demonstrates self-deprecation, lack of control, and apathy:
struggle with low self-esteem or self-image
are concerned about the state of the world
more likely to struggle with body image
In January 2024, MHA revised the answer choices to the question: “Think about your mental health test. What are the main things contributing to your mental health problems right now? Choose up to three.” This included changing “body image or self-image” into two separate categories, the addition of “state of the world,” and removal of “basic needs (no food or housing).” Low self-esteem or self-image was the top issue overall, with 54% of screeners selecting it as a main concern.
Among youth under 18 who scored at risk for a mental health condition, low self-esteem and body image remained top concerns.
Although the averages across screeners reveal the main concerns of the general population throughout this year, post-pandemic events have had profoundly different mental health impacts on different racial and ethnic groups, and the differences reveal some of the inequities that Black, Indigenous, and people of color face in the U.S. that directly affect their mental health.
Among the screeners who scored at risk for a mental health condition and reported their race/ethnicity in 2024: